AMG Kernel - Virtual Nature of Changing Value and Sentiment
AMG Kernel originates market data visualizations of changing sentiment with EDGAR filings submitted at SEC.gov; the primary integer store of data to inference truthful causal manifestations at the forefront of changing values, real and expected, in the $60 Trillion goods and services array of regulated securities markets assets.
AMG Kernel integrates the regulated data source with a secure private connection to analytic features that empower investors, advisors, exchange trading participants, and other subcribers to gain intelligence with interactive control of unique and personal visualizations of changing sentiment.
AMG Kernel transforms densified EDGAR integer form data with analytics that visualize truthful continuous demand for securitized open-end fund (including ETF) assets, and projects changing sentiment visualizations on an interactive 'etch-a-sketch' personal canvas.
The Financial sentiment dashboard extends and scales the actionable market data templates of True Value.
The algorithmic tool applies shared understandings of dollar-driven capital market continuous demand data visualizations of asset levels and flows; to templates that signal and train truthful AI inferencing sentiment in non-Financial dimensions, where structured questions about change and value are also relevant and matter at scale (media, tech, social, rideshare, determinative....).
The dashboard visualizes unique Fiduciary research of quantitative measures of continuous Financial values that signal truthful interactive visualizations of the causal manifestations of changing sentiment.
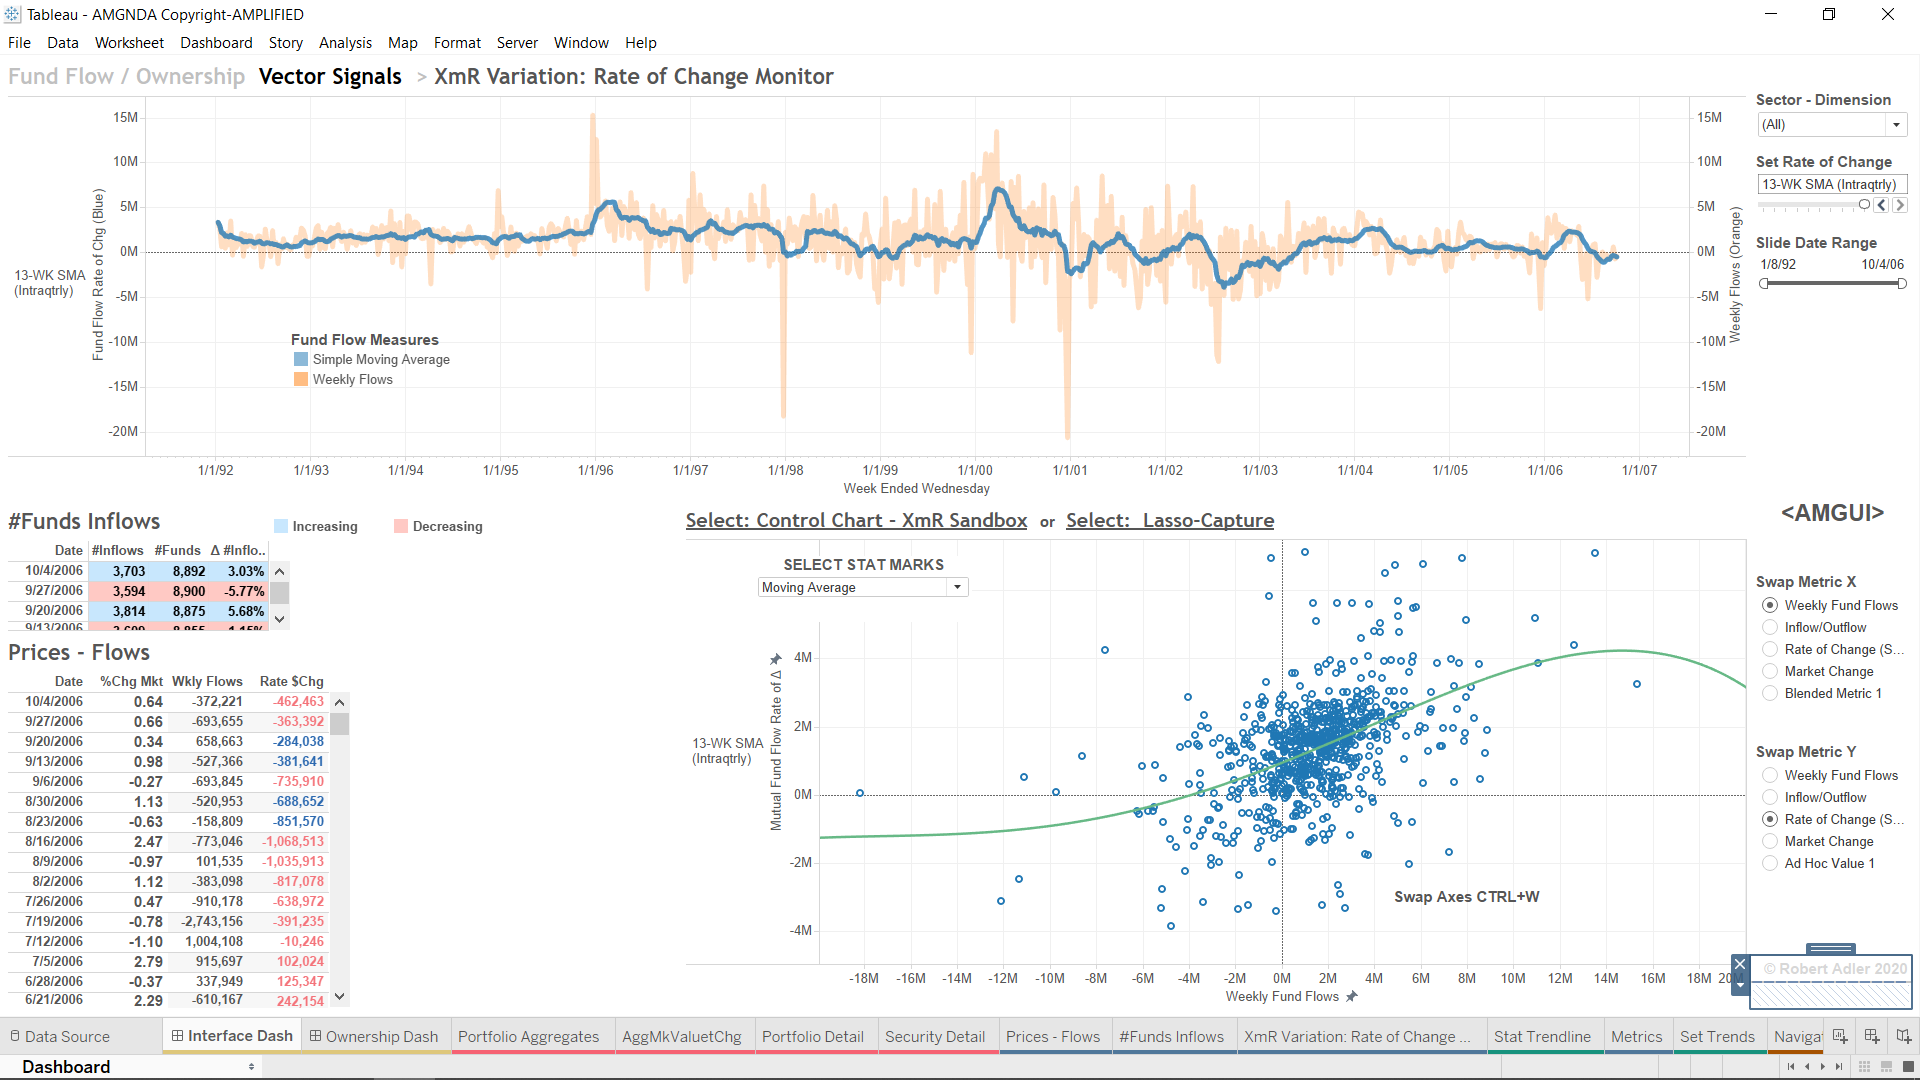
Subscribers access regulated asset data reported by open-end funds, and originate visualizations in two sentiment vectors of market demand: real investment cost (mutual fund and ETF net investment flow metadata), and expected market price action (portfolio data).
The analytics put three questions to the changing data values that infer qualitative notions of sentiment to train AI: How much? How many? How fast?
The magnitude and direction of the Financial data vectors, as well as the speed of the changing values, are visualized on templates that infer from the shared questions about how common values are changing.
The visualizations generate templates from the changing securitized dollar-driven capital market asset data; and enable each subscriber to train inferences that are as unbiased and trusted as the continuous data, itself.
The data reside in object storage (AWS cloud buckets, eg.):
s3://valuevector1 - Retail and Professional cash demand for securities visualized in open-end mutual fund (including ETF) net flow metadata.
s3://valuevector2 - Professional market demand for securities visualized in EDGAR portfolio asset, price, and share data filings submitted by investment management companies.
s3://valuevector3,4,5.... - Fiduciary and Customer Learning Visualization Templates of Value
The open-end fund asset price levels and cash investment flow information foot in the regulated data templates.
The method of arranging and merging data and analytics empowers each user to visualize the regulated data and interactively train the continuous integer values to learn a cognitive awareness of changing sentiment in any measured topic.
This copyright describes a unique and personal dashboard to originate visualizations that assert American economic sentiment data analytics as the kernel of 'truth to value' - to train alternative vectors of change - or 'whatever' mediums of exchange.
The analytics template trusted and regulated Financial data to train true inferences for insights about change that signal opportunity. (more...).
© 2025 Robert Adler TXu 2-489-251 Amplified, All Rights Reserved