AMG Kernel - Virtual Nature of Dollar-Driven Sentiment - POC
AMG Kernel originates interactive dashboards that visualize how trusted Financial market sentiment data are changing.
The market data visualizations are a proxy for changing investment sentiment, and model unique templates of safe harbor 'Section 28(e)' research as overlays of demand for assets.
The market sentiment analytic metaphor visualizes asset changes in filings submitted to the $60 Trillion primary source of continuous trusted dollar-driven data at the forefront of changing values, to train predictive templates of changing sentiment that are unique and personal interactive projections of the EDGAR integer data - https://SEC.gov
The market sentiment analytics visualize unbiased and trusted integer data that accrete in value with each filing submitted to the EDGAR database.
The algorithmic tool applies shared understandings of dollar-driven American capital market continuous demand data visualizations of regulated open-end fund (including ETF) asset levels and flows; to derive templates of market data fields; and train AI inferences about changing sentiment to determinative non-Financial dimensions, where structured questions about change and value are also relevant and matter (media, tech, social, rideshare, determinative....).
Two value vectors of sentiment, investment (real) and invested (expected), are dimensionalized in the asset data to derive interactive templates that signal and infer a cognitive awareness of how change is occurring, using the truthful continuous EDGAR data to train the visualizations.
The data reside in object storage (AWS cloud buckets, eg.):
s3://valuevector1 - Retail and Professional cash demand for securities visualized in open-end mutual fund (including ETF) net investment flow metadata describes how real market sentiment is changing; detailed and aggregated. (Template Dash)
s3://valuevector2 - Professional market demand for securities visualized portfolio asset, price, and share filings submissions to EDGAR by investment management companies. The data describe changing ownership asset and share levels and flows (Template Demo).
s3://valuevector3,4,5.... - Fiduciary and Customer Learning Visualization Templates of Value
The interactive dashboards visualize a metaphor for change in data vectors of market demand where quantitative measures of value are applied to qualitative notions of sentiment.
The templates visualize and signal How dimensional change is manifest with three asks put to the continuous data: How much? How many? How Fast?
The visualizations signal inferences how sentiment is changing in EDGAR portfolio filing data (expected value), and mutual fund net flow (including ETF) metadata (real value).
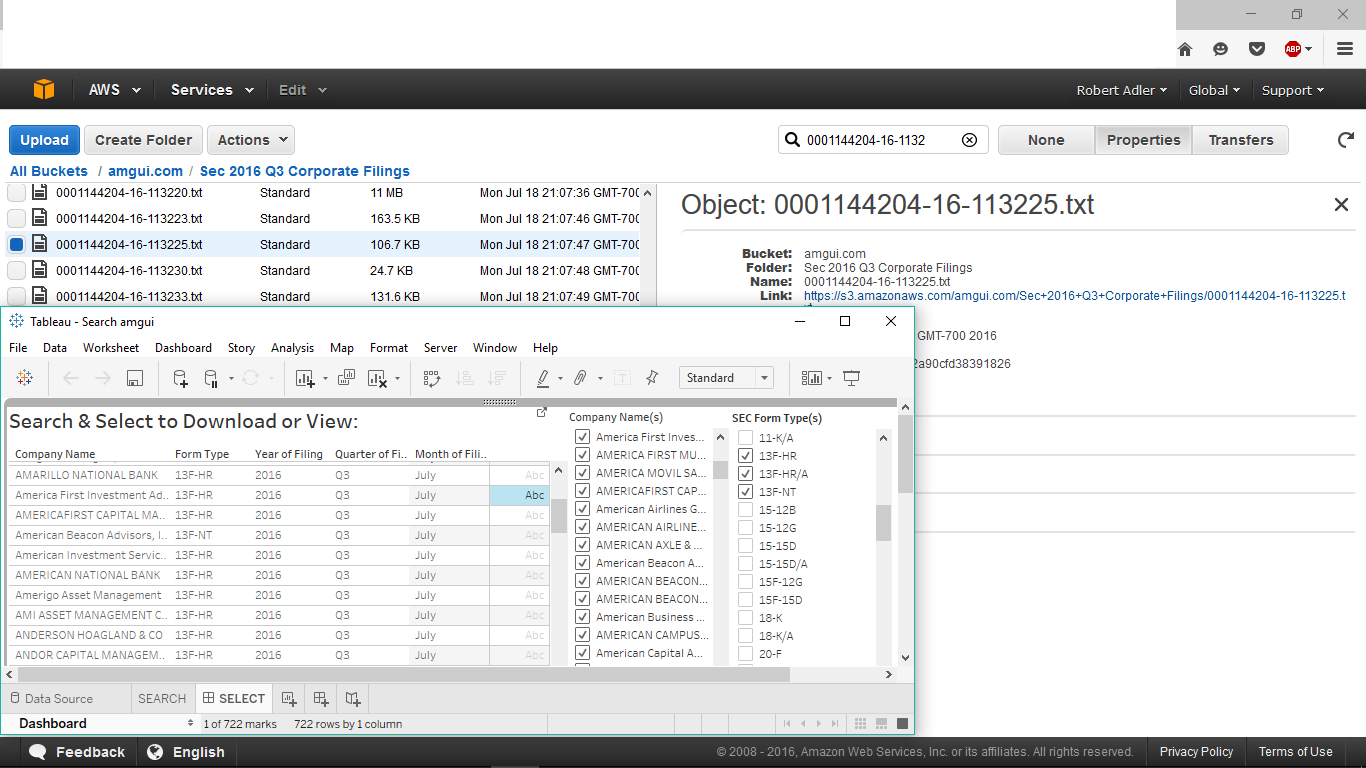
The private connection secures interactive dashboard visualizations of data submissions (SEC.gov -> Asset Levels/Flows, Securities, Portfolios) to train AI.
The connection facilitates public/private cloud access to individual SEC filings (1995-2025YTD); prepared and transformed for visual analyses.
Templates of Asset Levels and Share - $(000) Flow data visualize data sets of financial market filings: Corporate Changes and Professional Portfolio Changes.
Tableau Dashboards or AWS Quicksight Author-Reader Dashboards visualize sentiment templating trusted value data sourced in the EDGAR submissions that augment training software like AWS Sagemaker, eg.
Access is enabled to 40 million SEC filings in 300+ form types residing in AWS S3 Object Storage (Local/Cloud); transformed to populate a table per fixed interval [Access to ETF data daily, unified in flexible intraday tic by tic intervals], and distributed in a structured format for unique Fiduciary research.
The market data is transformed for visualization using AWS QuickSight, Tableau Desktop, private label and ad hoc data visualization platforms.
Templated dashboards are prepared for a seamless connection to popular and emerging BI visualization software like AWS QuickSight or Tableau+ AWS SageMaker, etc.
Example Template Visualization Mechanisms - Visual & Verbal Dimensional Descriptions - Capital Asset Metaphor:
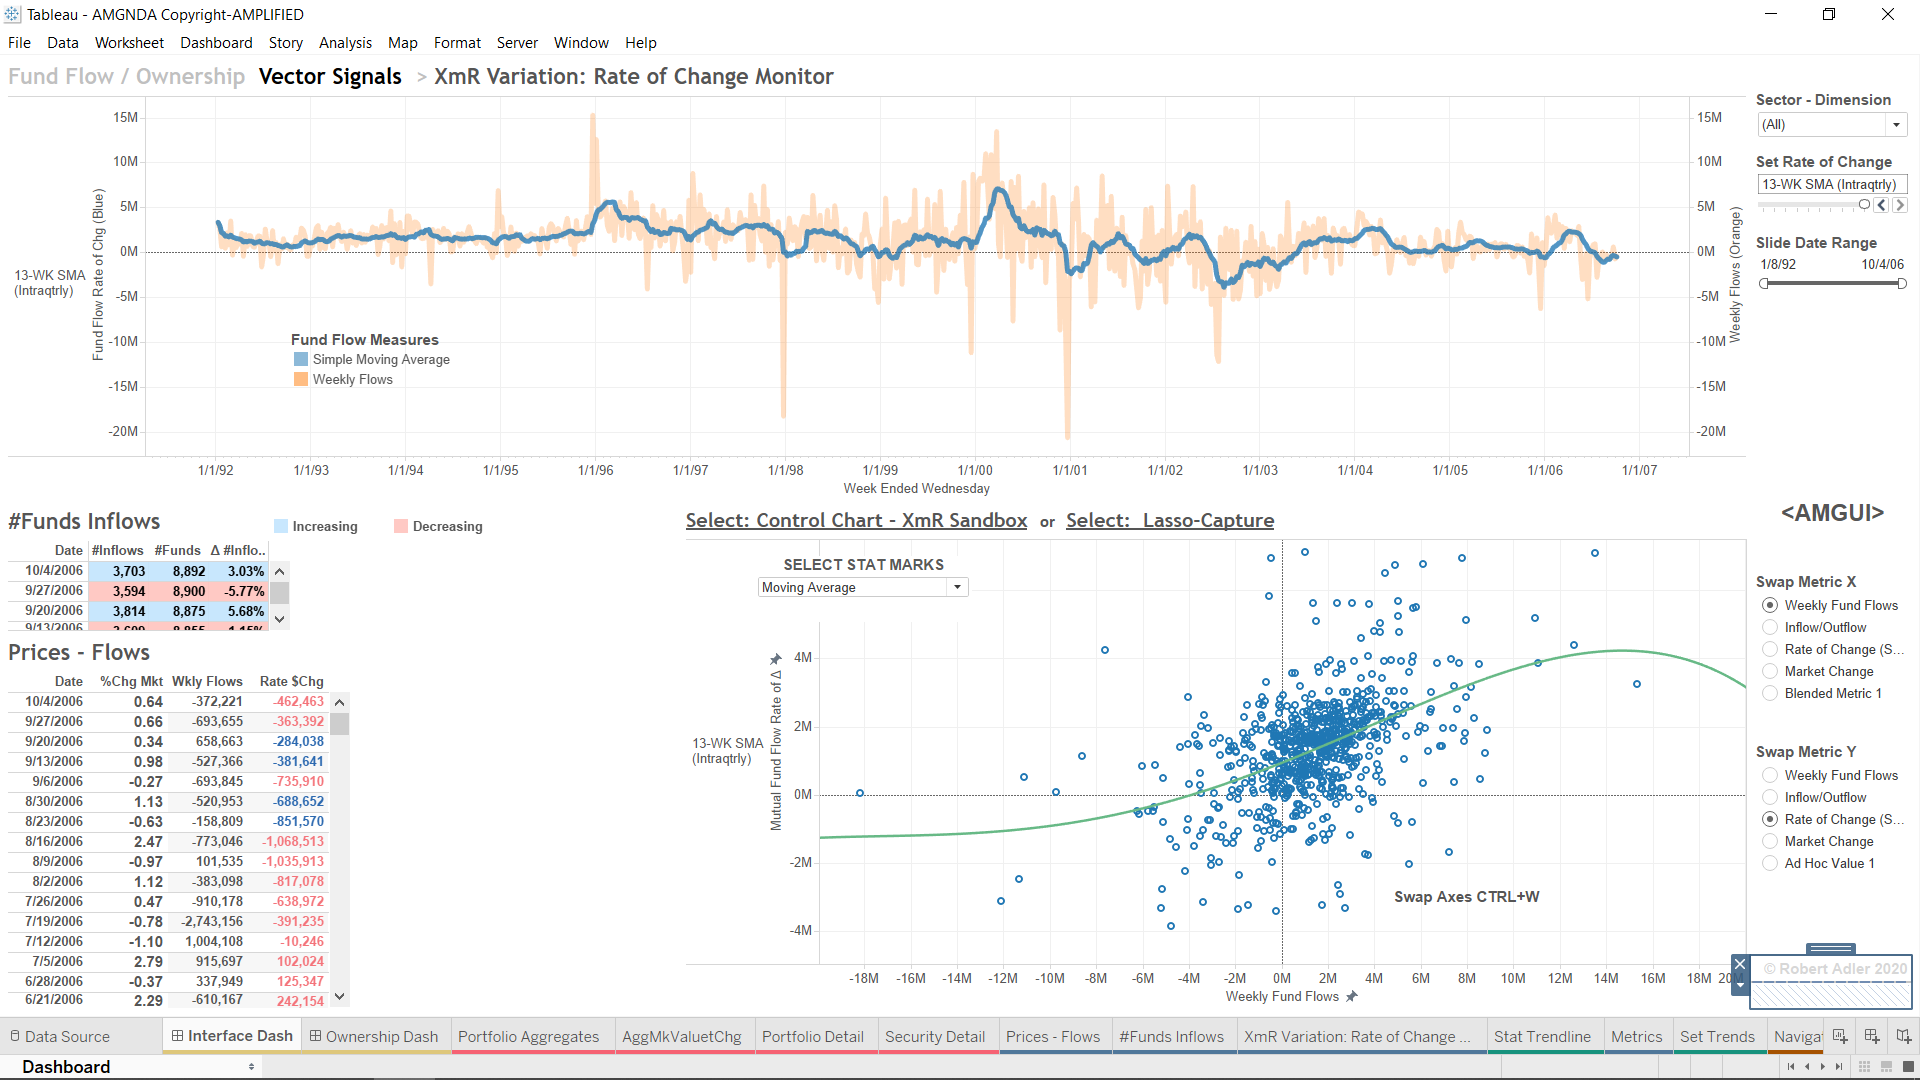
Investor Fund Flow Paradigm - Investor Fund Flows Dashboard Template Visualization:
1) Visualize Changing Mutual and ETF Fund Flow metadata - FundFlows Viz Descriptions: (1), (2), (3)
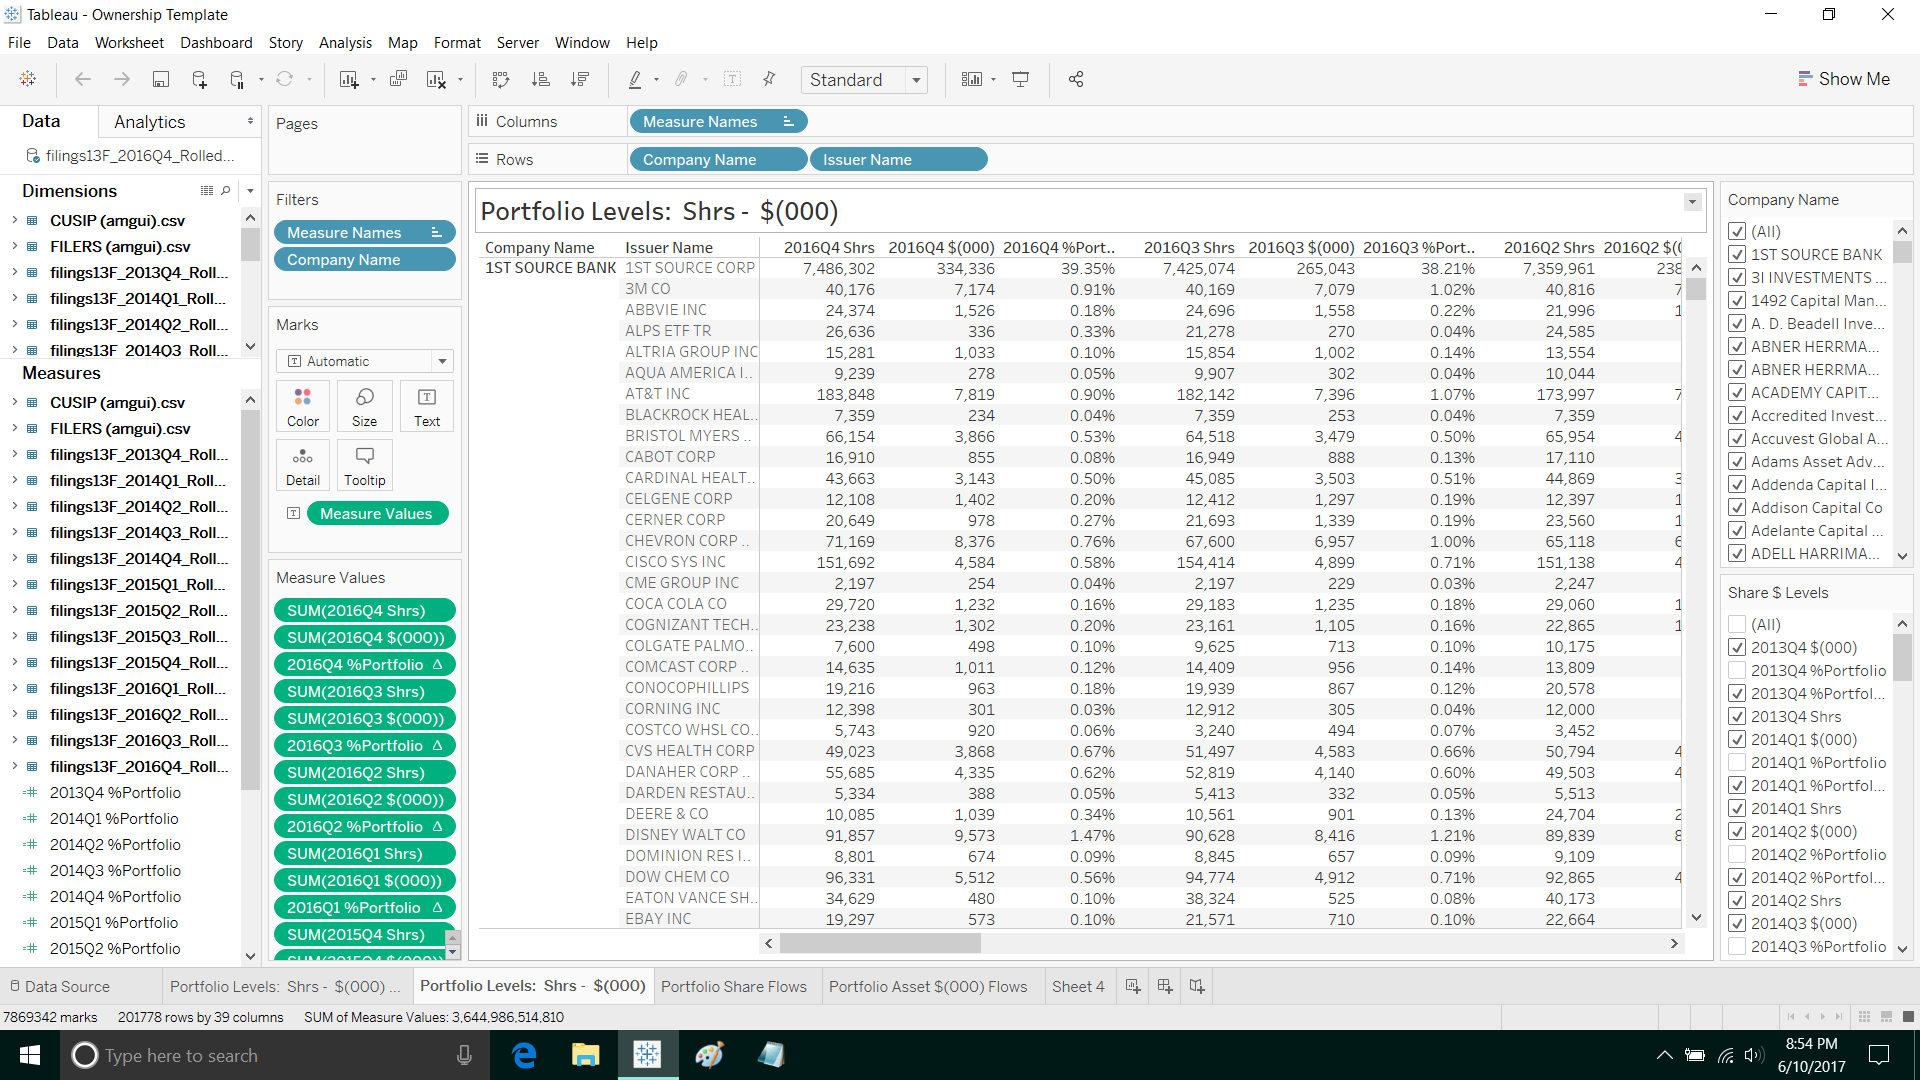
Securitized Asset Levels Paradigm - Asset Levels Template Viz A
2) Visualize Changing Asset Level data - Asset Levels Viz Description - A
Securitized Asset Flows Paradigm - Asset Flows Template Viz B
3) Visualize Changing Asset Flow data - Asset Flows Viz Description - B
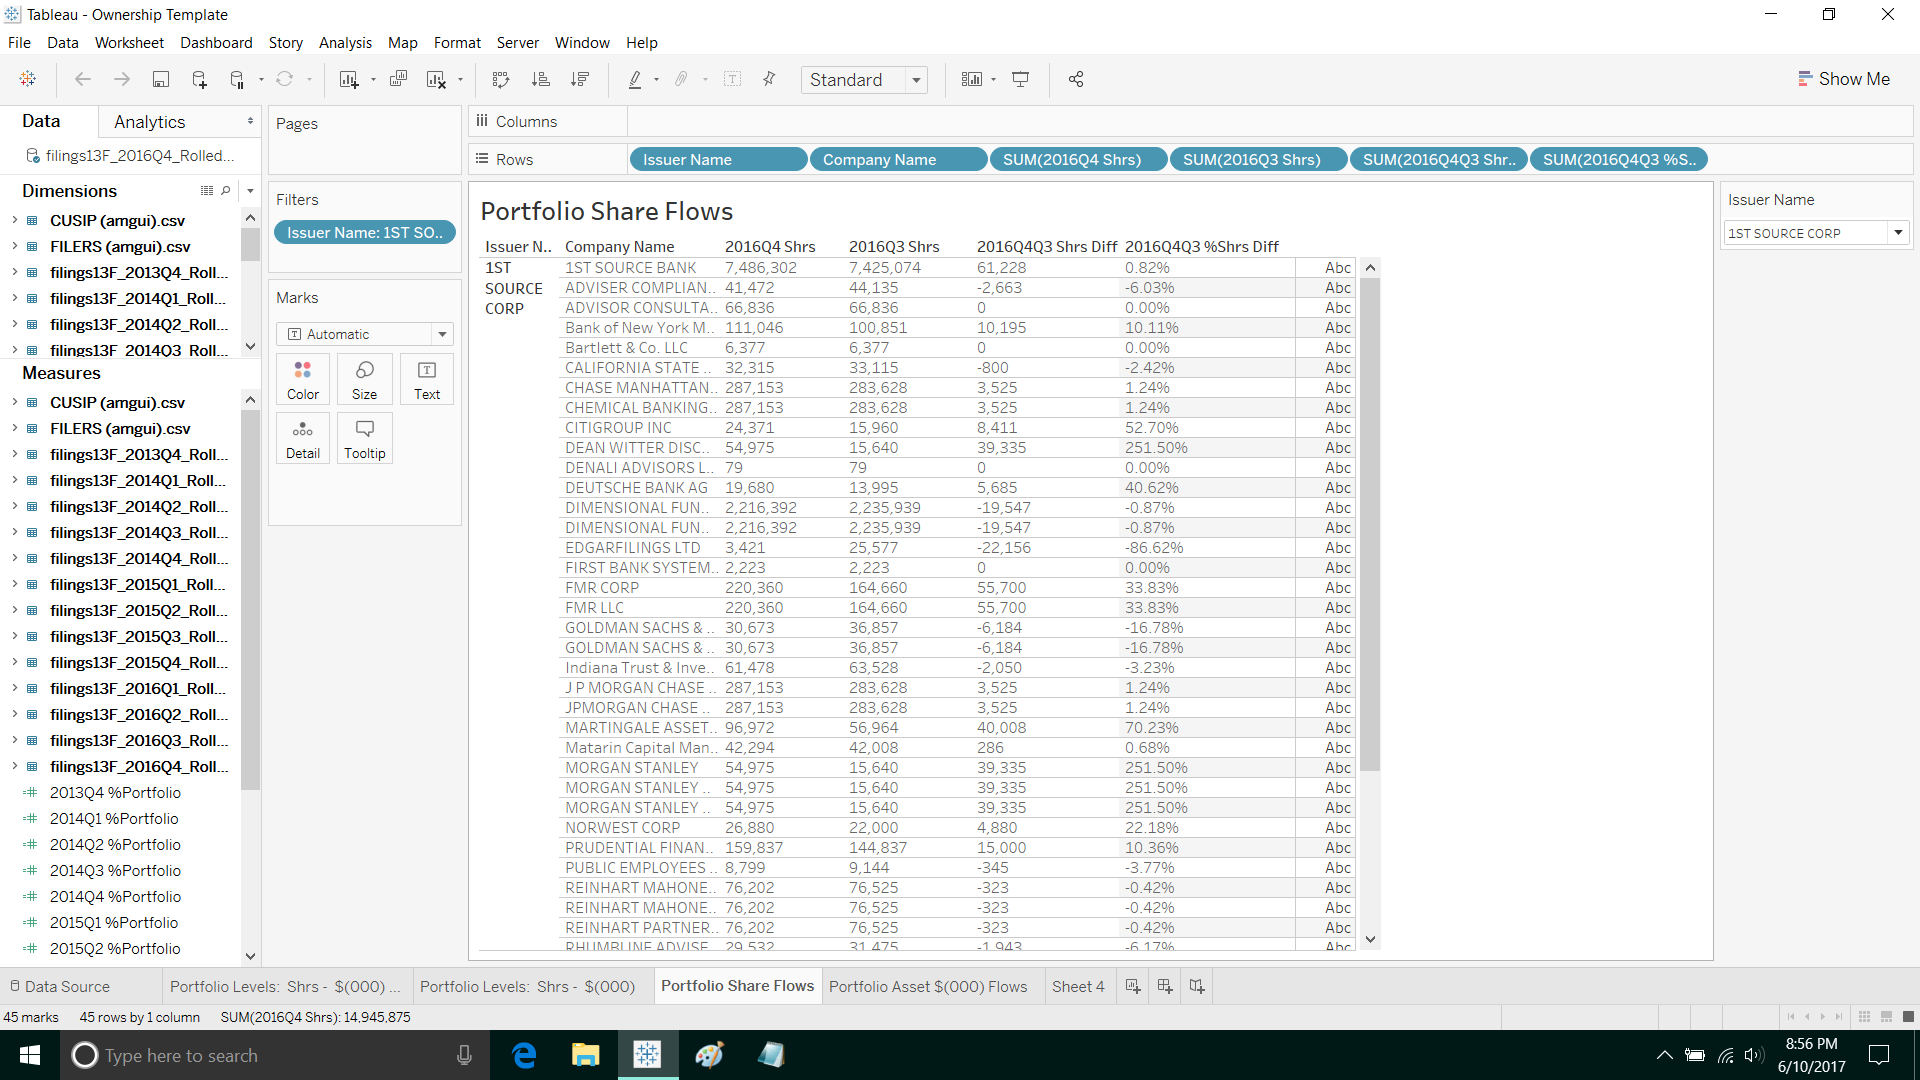
Securitized Share Flows Paradigm - Share Flows Template Viz C
4) Visualize Changing Share Flow data - Share Flows Viz Description - C
Flexible Local, Cloud, or Hybrid Options for independent VPN strategies.
The data are visualized along dimensional ids, enhanced by the software marking systems that articulate the dimensional measures; size, shape, color, position, orientation.
Analytics are created or templated for authorship and consumed by ranges of subscribers for interactive, unique, and personal research that originates calculable visualizations of changing values and sentiment data in the EDGAR filings - to truthfully train AI.
This concept describes interactive dashboard overlays that train American dollar-driven capital market open-end fund asset sentiment data values as templates forming the kernel of 'truth to value' to infer how non-Financial, unregulated, and alternative vectors of sentiment, or 'whatever' mediums of exchange - are changing .
© 2025 Robert Adler TXu 2-489-251 Amplified, All Rights Reserved
 Flows B.png)