AMG Kernel - Virtual Nature of Changing Value and Sentiment
AMG Kernel originates calculable visualizations of changing sentiment with Financial filings at SEC.gov; the primary integer data store for analytics of the causal manifestations of change, real and expected, in the $50 Trillion goods and services array of regulated securities markets assets.
AMG Kernel integrates the SEC data source with a secure private connection to dashboard features that empower investors, advisors, exchange trading participants, and other subcribers with interactive control of unique and personal visualizations of changing sentiment.
AMG Kernel transforms densified SEC form integer data with a cloud or hybrid learning narrative that truthfully visualizes demand for capital assets and projects changing market sentiment values on an 'etch-a-sketch' personal dashboard canvas; then scales the interactive and actionable templates of value to Financial and non-Financial dimensional structures where change matters (media, tech, social, determinative....).
The dashboard interface visualizes market sentiment vector time series data then learns and templates qualitative projections that signal an awareness of truthful and uniquely personal interactive 'etchings' about how the relevant values are changing.
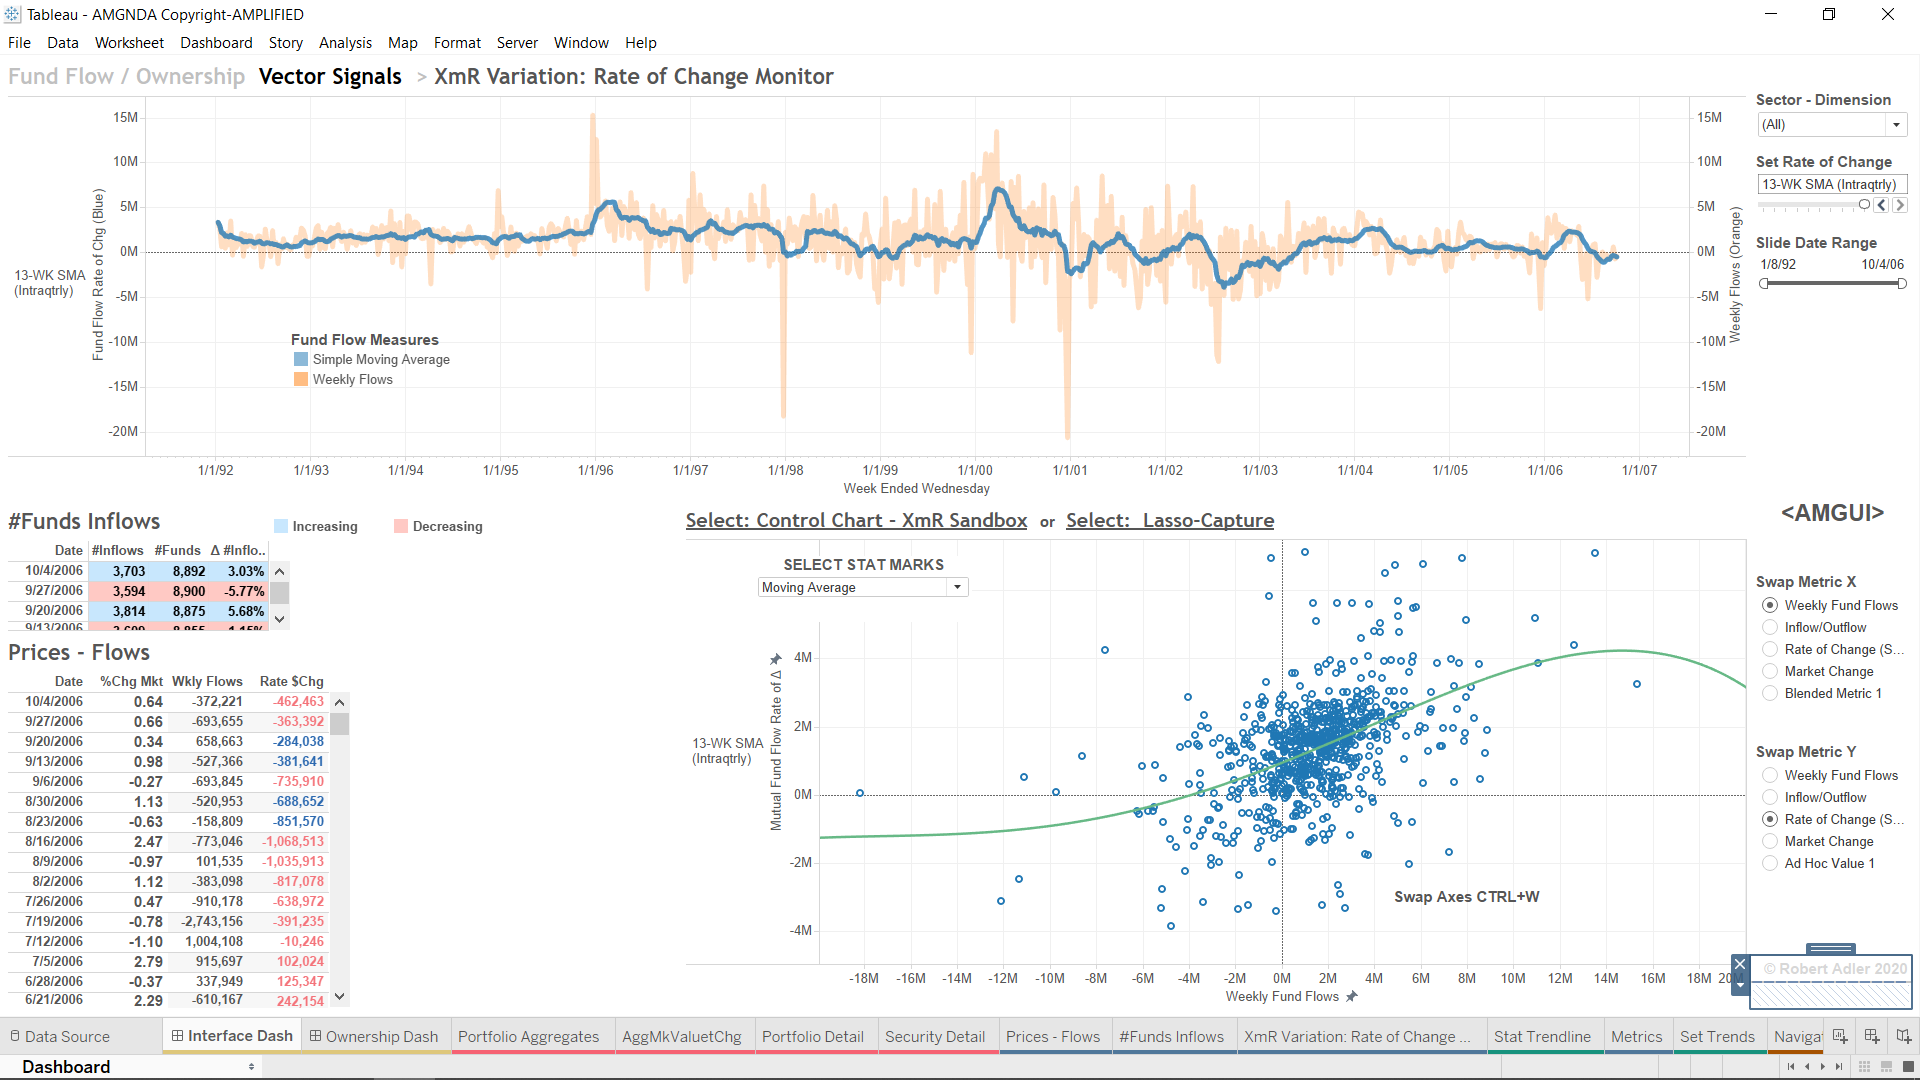
Subscribers access regulated data for open-end funds and originate visualizations in two sentiment vectors of market demand: real investment cost (mutual fund and ETF net investment flow metadata), and expected market return (portfolio data);
The Analytics ask three questions of the changing data values to infer qualitative notions of sentiment: How much? How many? How fast?
The interactive dashboard visualizes, labels, and learns the magnitude and direction of the Financial data vectors, as well as the speed of the changing values, and projects templates of value from the subscriber's virtual kernel of quantitative truths about how common change is understood.
The projections render true insights that are derived from common understandings about the changing nature of regulated dollar-driven capital market asset values; insights that are as unbiased and trusted as the continuous data, itself.
The data reside in object storage (AWS cloud buckets, eg.):
s3://valuevector1 - Retail and Professional cash demand for securities visualized in open-end mutual fund (including ETF) net flow metadata.
s3://valuevector2 - Professional market demand for securities visualized in portfolio asset, price, and share data filings submitted by investment management companies.
s3://valuevector3,4,5.... - Learning templates of value
The open-end fund asset price levels and cash investment flow information foot in the regulated data dashboard templates.
Example Dashboard Mechanisms: AWS QuickSight+AWS SageMaker Canvas Models; Tableau CRM 'Fund Flow Dashboard' with AWS SageMaker, or ad hoc connection.
The method empowers the user to visualize the regulated data and interactively template the continuous integer values that originate with a unique, personal, and truthful awareness of changing sentiment in any measured topic.
The analytics template trusted and regulated Financial data to infer true sentiment for insights about change that signal opportunity. (more...).